検索ボックス
検索フォーム
Synchro Wave Analyzer
SWA Series
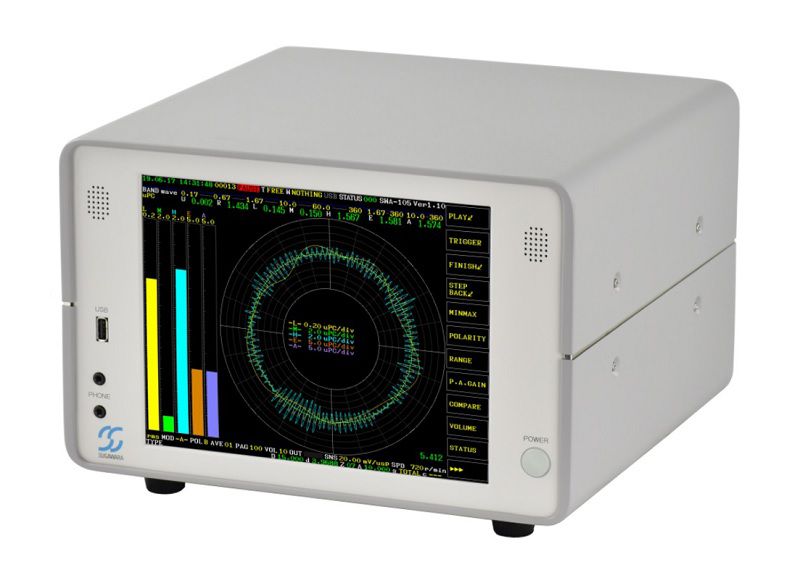
Uses high-speed digital processing to display spectra in real time
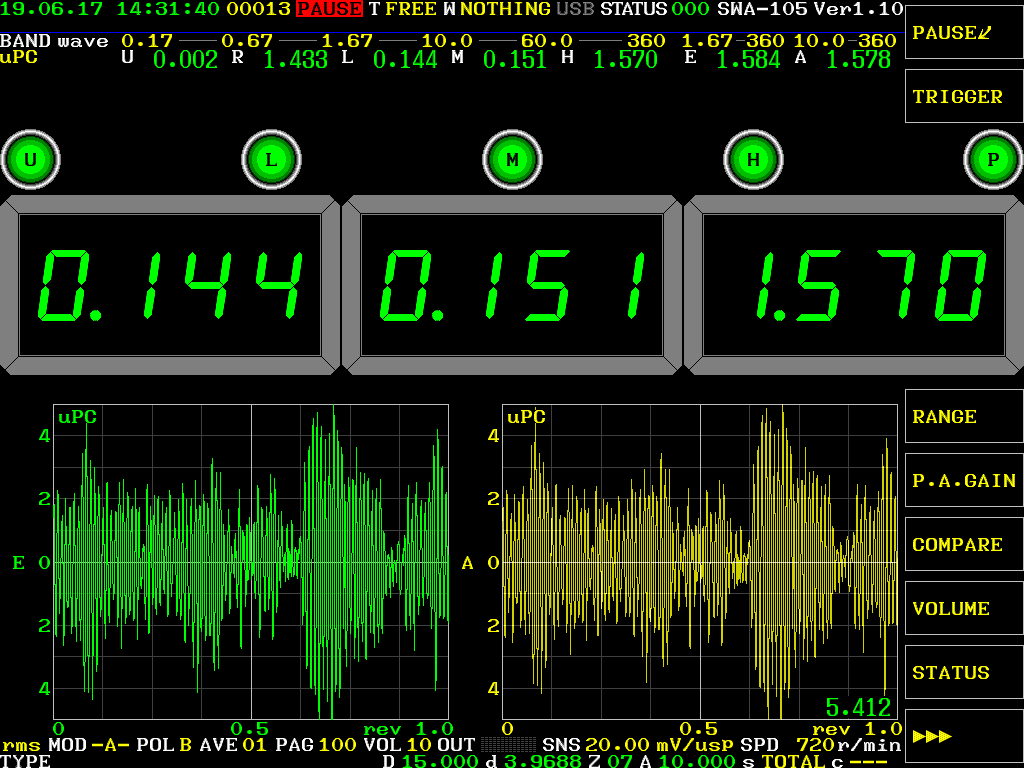
The SWA-105 analyzes the waviness and roundness of inner and outer race surfaces and the surfaces of balls used in ball bearings. The measurement results are not only divided into numerical values by vibration frequency band, but can also be displayed as spectral plots and in polar coordinates, or as vibration waveforms, allowing the quality of test pieces to be evaluated with greater speed and ease. The waveform data can also be recorded onto and played back from a USB memory. The device has a small built-in speaker and can also be connected to headphones or external speakers.
SWA-105 - Main Features
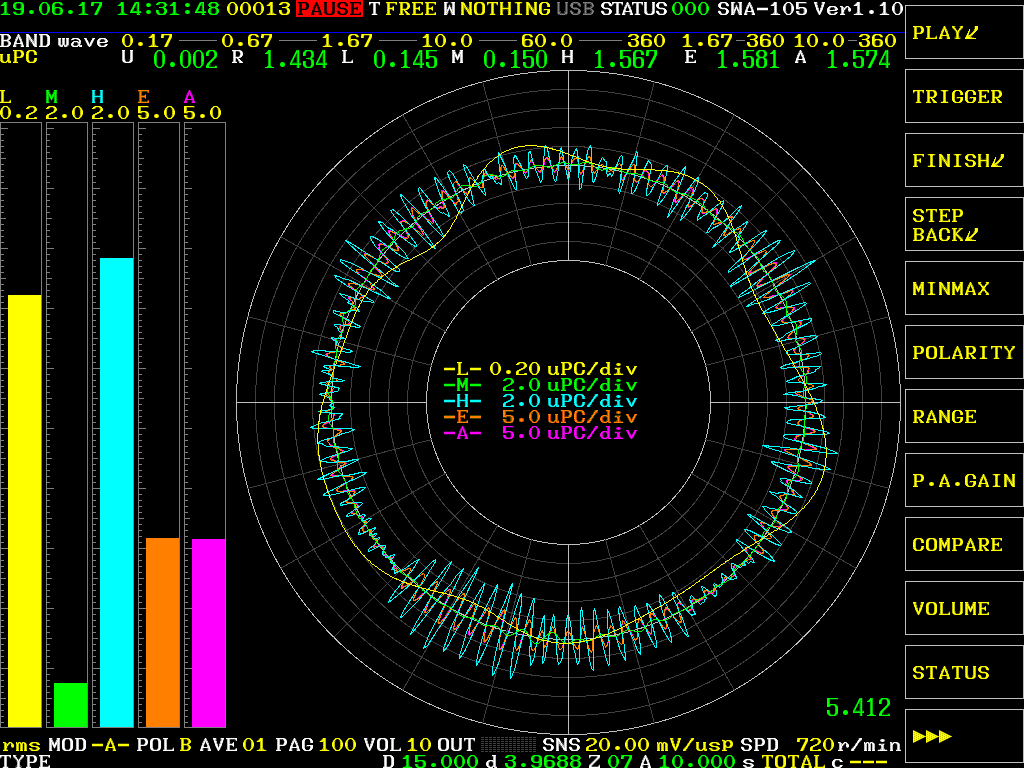
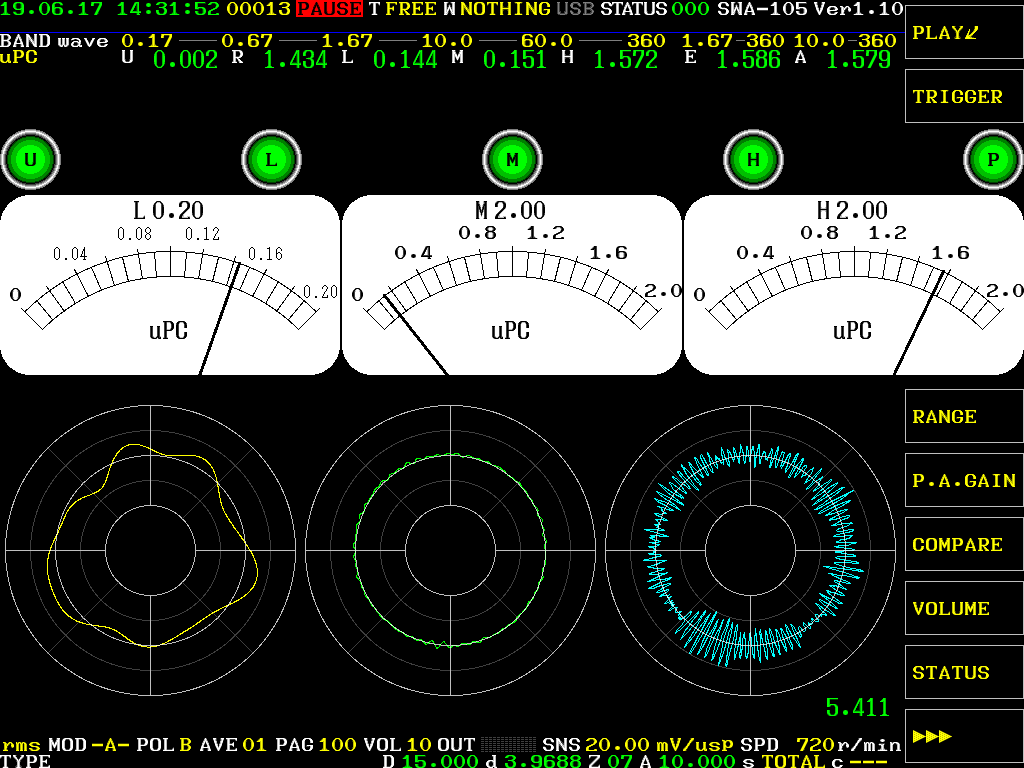
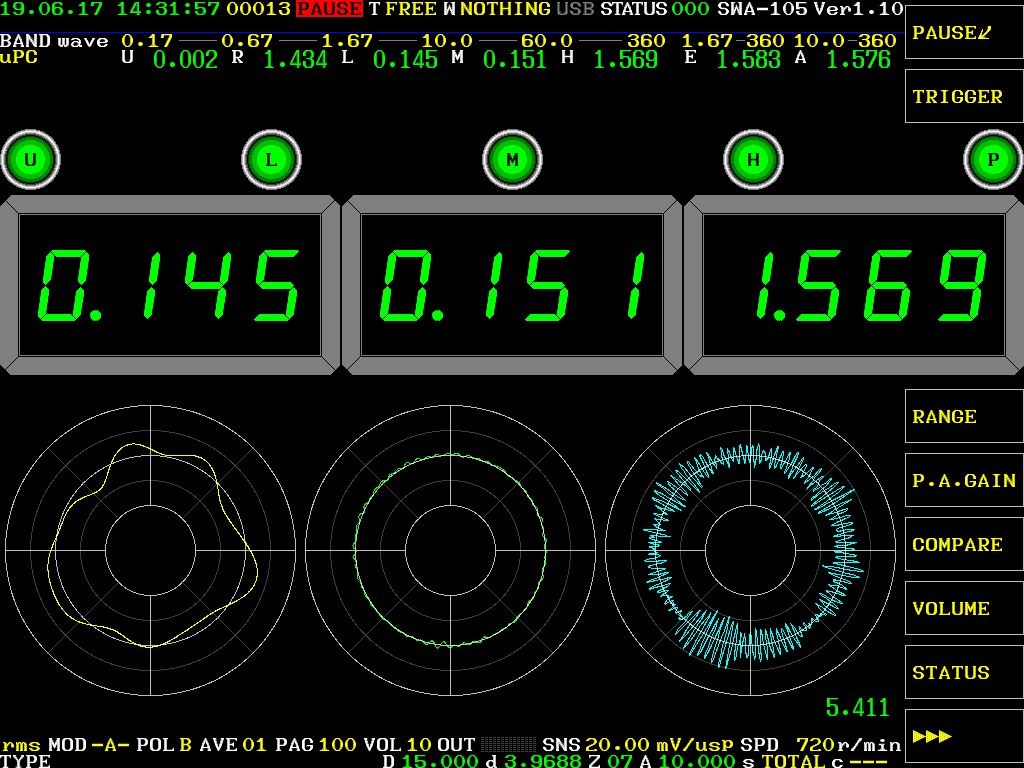
- Polar graphs make it possible to grasp the shape of a test piece with high accuracy at the nanometer level
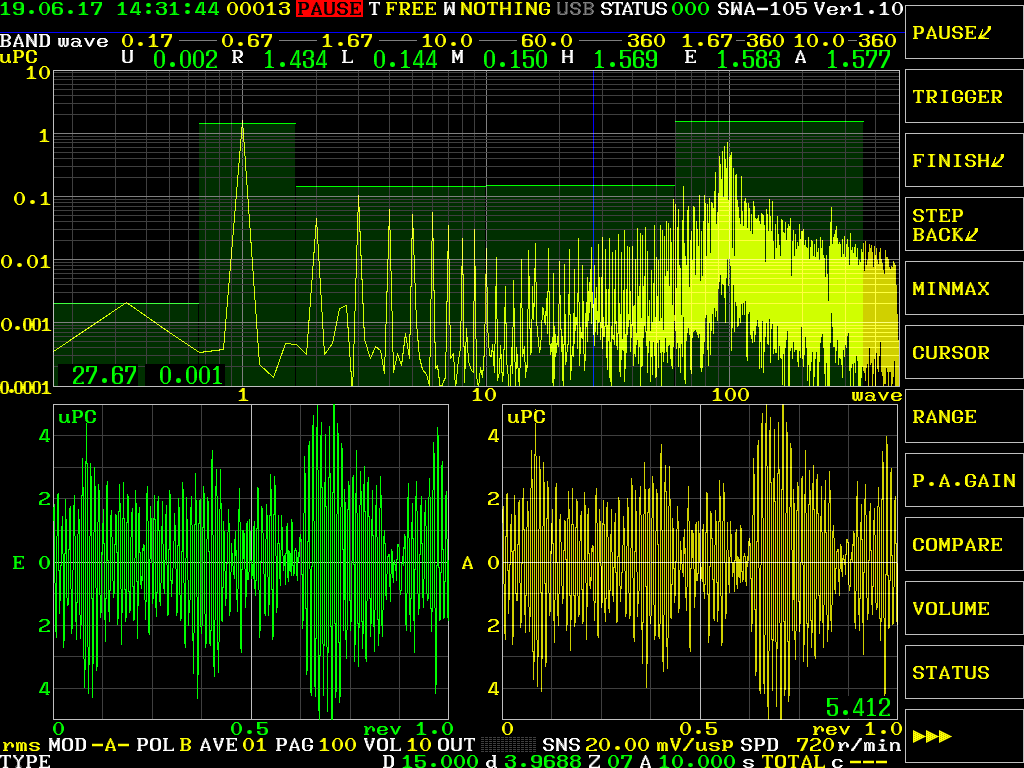
- By displaying the spectrum and waviness waveform simultaneously, it is possible to grasp the shape while analyzing its waviness components
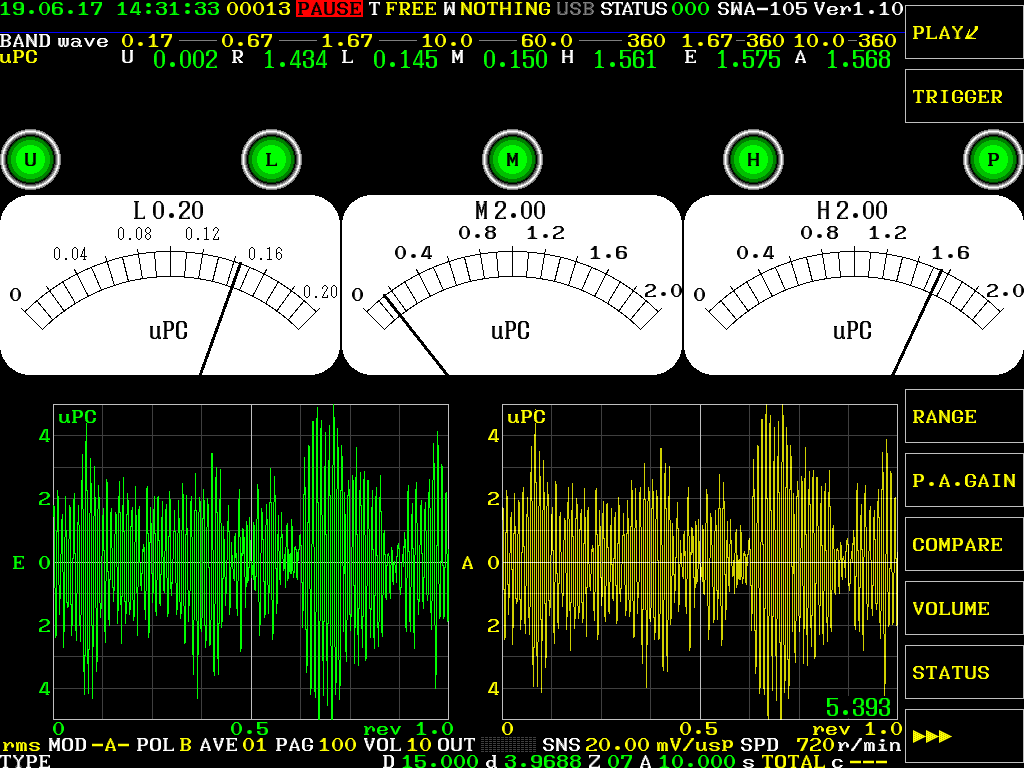
- The 10.4 inch high-definition color display shows data and graphs in real time
There is no lag between the audio output and screen display as a result of data processing, which aids comfortable viewing - With bwm (bandwidth mean) processing, it is possible to produce a display equivalent to an Anderon spectrum
- Measurements can be made in seven frequency bands: U, R, L, M, H, E and A. Each band can be set independently
- Pass/fail judgments can be performed by providing threshold values in seven bands and "crest factor + frequency" settings. These judgment results can also be externally output as photo relay contact signals
- Two headphone output channels allow two people to listen to vibration noise simultaneously
- Measurement units: uPC, uWcla, nmPC, nmWcla, uinch/rad, uinch/sec, uinch, um/rad, um/sec, um, nm/rad, nm/sec, nm, mG, cm/s²
- Can be calibrated using an ADC-101 Anderon calibrator
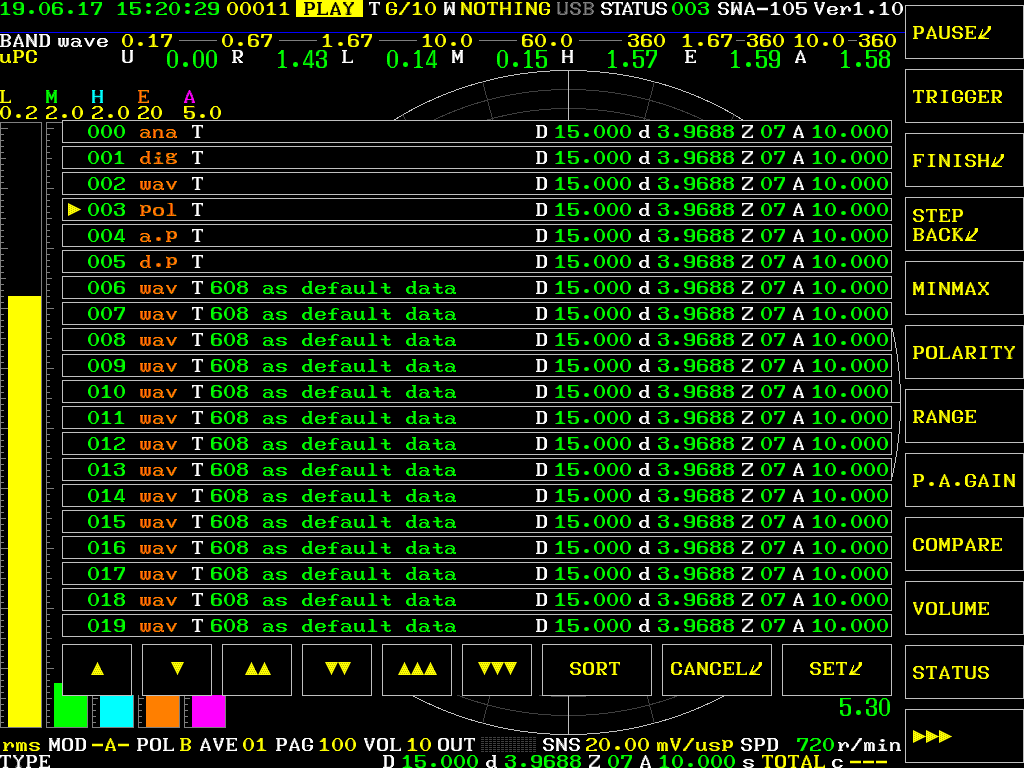
- Up to 1000 sets of measurement conditions can be saved and searched using a list
- The equipment can record and play back up to 30 seconds of vibration noise, allowing quality control to be performed based on the master sample data
- Recording data, measurement data, measurement conditions, and screen copies can be saved to a USB memory
- Hard copies of the screen display can be made using an optional USB thermal printer
Catalog PDF
Inquiry for this product
Copyright (c) Sugawara Laboratories Inc. All rights reserved.